

What is Data Analytics
In today’s digital economy, data is often referred to as the “new oil.” Companies generate 2.5 quintillion bytes of data daily, but the real challenge is not just collecting data—it’s making sense of it.
A recent survey found that 91% of businesses invest in data analytics, but only 26.5% have successfully built a data-driven culture.
Many businesses struggle with:
- Data Overload – Collecting massive amounts of data without knowing how to use it effectively.
- Lack of Proper Tools – Not having the right software to analyze data efficiently.
- Shortage of Skilled Analysts – A lack of trained professionals who can interpret and act on insights.
This is where data analytics comes in. It helps businesses turn raw data into valuable insights, allowing them to make informed decisions, reduce risks, and improve operations.
Understanding Data Analytics
Data analytics is the process of collecting, cleaning, analyzing, and interpreting data to find meaningful patterns, trends, and insights. It helps businesses understand customer behavior, optimize operations, and drive growth.
For example, Amazon uses data analytics to recommend products based on customer preferences, and Netflix analyzes viewing habits to suggest personalized content.
Data analytics is used in various industries, including:
- Retail – Understanding customer buying patterns.
- Healthcare – Predicting disease outbreaks and patient needs.
- Finance – Detecting fraudulent transactions.
- Manufacturing – Optimizing supply chain management.
According to a report by McKinsey, organizations that use data-driven decision-making are 23 times more likely to acquire customers and 19 times more likely to be profitable.
Clearly, data analytics isn’t just an advantage—it’s a necessity.
Steps in Data Analytics
Data analytics is not just about crunching numbers; it’s a structured process that involves collecting, processing, analyzing, and interpreting data to extract valuable insights. Following a well-defined framework ensures accuracy, reliability, and actionable results.
Here’s a breakdown of the six key steps in data analytics and how businesses use them to make informed decisions.
1. Data Collection – Gathering Raw Information
The first step in data analytics is collecting relevant data from multiple sources. The quality and accuracy of data at this stage determine the reliability of the final analysis.
2. Data Cleaning – Removing Errors and Inconsistencies
Raw data is often messy, containing duplicate entries, missing values, or incorrect formats. Data cleaning ensures accuracy and consistency before analysis begins.
3. Data Processing – Structuring Data for Analysis
Once the data is clean, it needs to be structured and organized for easy analysis. This step involves transforming raw data into a usable format.
4. Data Analysis – Extracting Insights and Patterns
At this stage, businesses apply statistical techniques, machine learning models, or AI algorithms to extract meaningful insights from data.
5. Data Interpretation – Making Informed Decisions
Interpreting data means translating numbers into meaningful business insights. The goal is to answer critical business questions and guide decision-making.
6. Data Visualization & Reporting – Communicating Findings
The final step is to present insights using charts, graphs, and dashboards for easy understanding.
Data analytics is a step-by-step process that transforms raw data into valuable insights. Here’s a quick summary of the six steps:
| Step | Purpose | Outcome |
|---|---|---|
| Data Collection | Gather data from multiple sources | High-quality, relevant data |
| Data Cleaning | Remove errors, duplicates, and inconsistencies | Accurate and reliable dataset |
| Data Processing | Structure and format data for analysis | Organized and usable data |
| Data Analysis | Apply statistical models and machine learning | Meaningful insights and patterns |
| Data Interpretation | Convert insights into business decisions | Informed decision-making |
| Data Visualization | Present data using charts and dashboards | Clear and actionable reporting |
Types of Data Analytics
Data analytics can be categorized into four key types, each serving a specific purpose in the decision-making process. These types help businesses understand past trends, diagnose problems, predict future outcomes, and provide actionable recommendations.
1. Descriptive Analytics – “What Happened?”
Descriptive analytics is the foundation of data analytics, focusing on summarizing historical data to identify patterns and trends. It provides a clear picture of past performance and is often used in business reports, dashboards, and data visualizations.
Common Tools: Excel, Google Analytics, SQL, Tableau, Power BI
Descriptive analytics does not explain why something happened, but it provides a solid starting point for deeper analysis.
2. Diagnostic Analytics – “Why Did It Happen?”
While descriptive analytics tells you what happened, diagnostic analytics goes a step further to uncover why it happened. It helps businesses identify root causes and correlations by analyzing historical data.
Common Techniques: Data mining, correlation analysis, drill-down analysis, regression analysis
By understanding the “why” behind trends, businesses can make informed decisions to improve future performance.
3. Predictive Analytics – “What Will Happen?”
Predictive analytics uses machine learning, AI, and statistical models to forecast future trends. It helps businesses anticipate challenges and opportunities based on historical data.
Common Techniques: Machine learning, predictive modeling, neural networks, decision trees
According to a research by Deloitte, companies using predictive analytics are 2.9 times more likely to experience revenue growth of 10% or more per year.
4. Prescriptive Analytics – “What Should We Do?”
Prescriptive analytics is the most advanced type, using AI and automation to recommend the best course of action. It not only predicts future outcomes but also suggests how to achieve desired results.
Common Techniques: Optimization algorithms, reinforcement learning, deep learning, real-time decision-making
Choosing the Right Type of Data Analytics
Each type of data analytics plays a crucial role in business intelligence and decision-making:
| Type | Purpose | Key Benefit |
|---|---|---|
| Descriptive | Summarizes past data | Provides insights into trends |
| Diagnostic | Finds root causes | Helps understand problems |
| Predictive | Forecasts future outcomes | Enables proactive decision-making |
| Prescriptive | Recommends actions | Optimizes strategies & automation |
Most businesses use a combination of these analytics types to drive success. For example, a company might use:
- Descriptive analytics to review past sales data
- Diagnostic analytics to find out why sales dropped in a certain region
- Predictive analytics to forecast demand for the next quarter
- Prescriptive analytics to optimize pricing and marketing strategies
Techniques Used in Data Analytics
To extract valuable insights, businesses use a variety of data analytics techniques:
- Data Mining – Discovering patterns in large datasets (e.g., finding customer buying trends).
- Statistical Analysis – Using mathematical models to analyze and interpret data.
- Machine Learning & AI – Automating data-driven decisions with smart algorithms.
- Data Visualization – Presenting data through charts, graphs, and dashboards for better understanding.
Companies use a mix of these techniques to improve efficiency, customer experience, and revenue.
The Role of Data Analytics in Business
Data analytics plays a pivotal role in modern businesses by transforming raw data into actionable insights. Whether it’s identifying customer preferences, predicting market trends, or optimizing supply chains, data analytics helps organizations make strategic decisions based on facts rather than intuition.
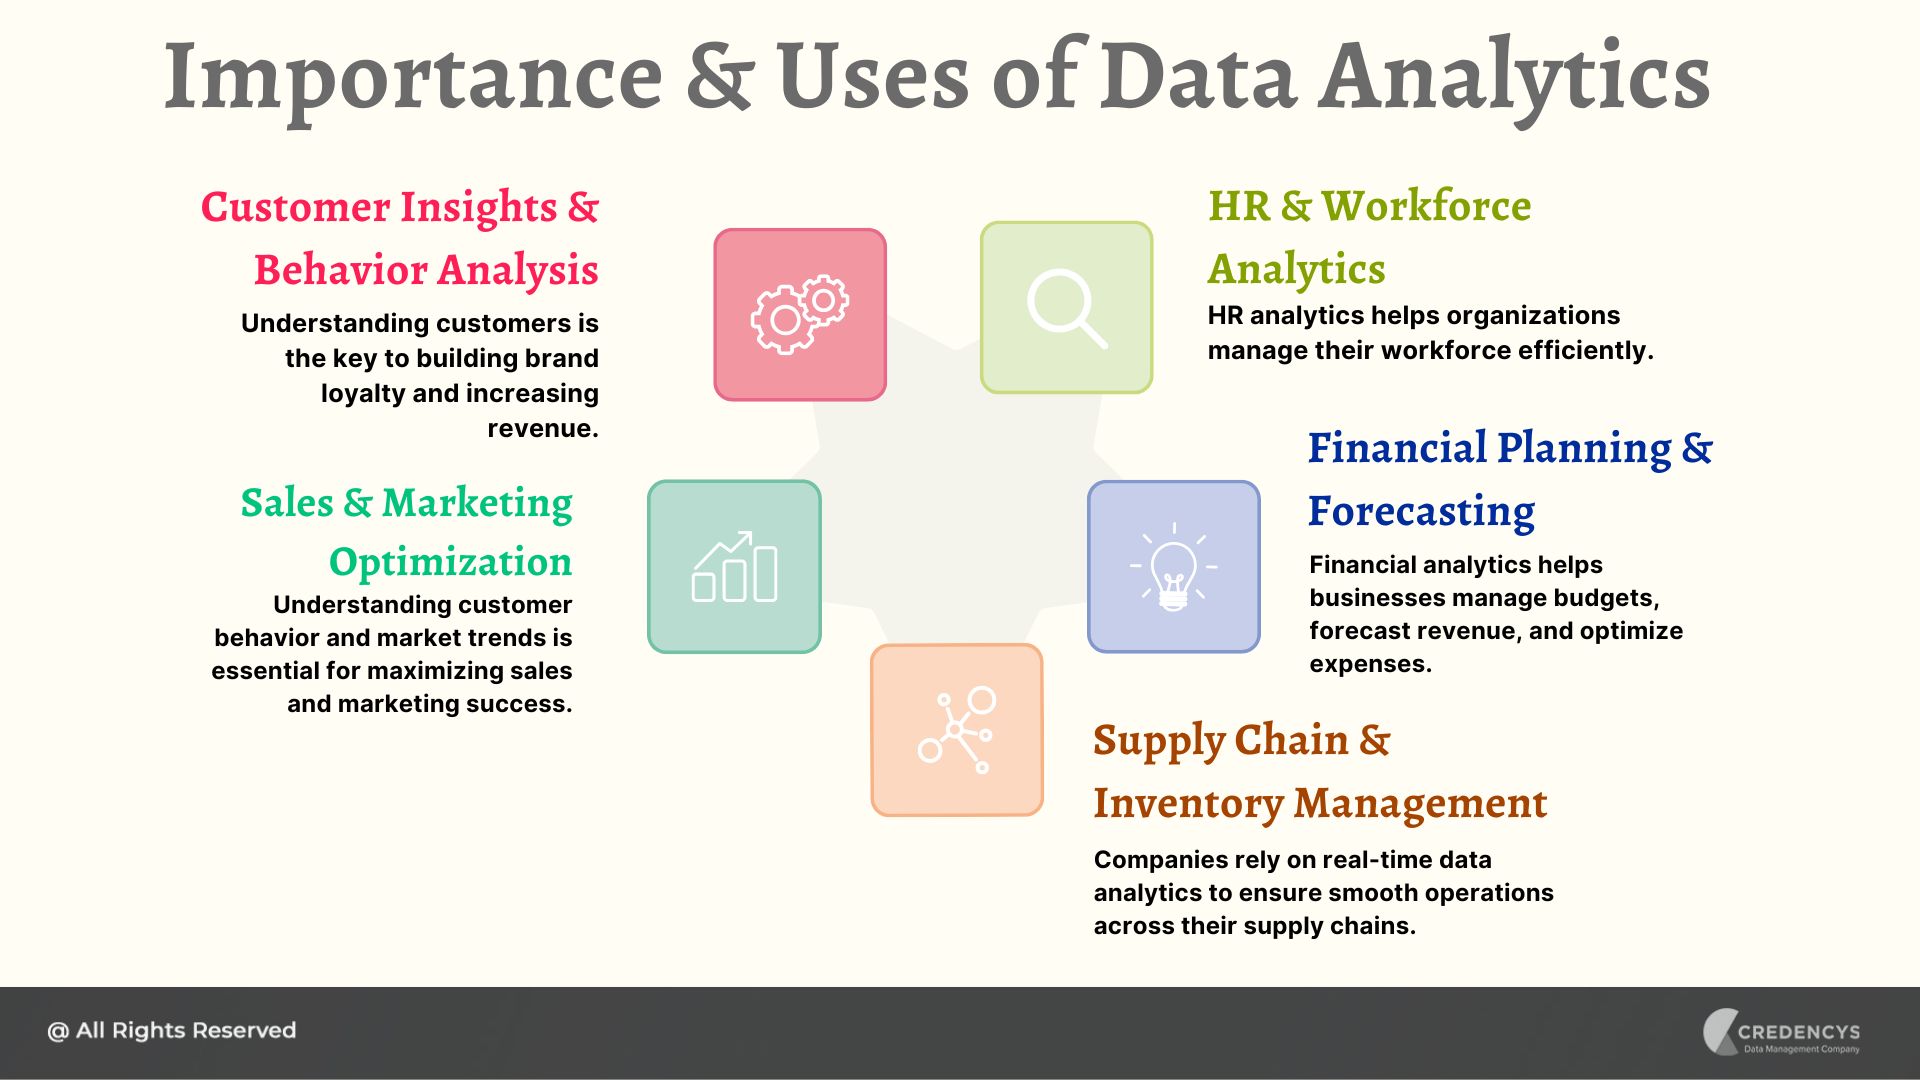
Here’s how data analytics contributes to business success:
1. Data-Driven Decision Making
Gone are the days of making business decisions based on gut feeling. Data analytics empowers organizations to back every decision with data, reducing risks and improving accuracy.
Companies that use data-driven decision-making are 23 times more likely to acquire customers and 6 times more likely to retain them (McKinsey).
2. Enhancing Customer Experience & Personalization
Understanding customer behavior is crucial for success. Data analytics helps businesses personalize interactions, leading to higher customer satisfaction and loyalty.
Personalization driven by analytics can boost revenue by 10-15% while improving customer engagement (Boston Consulting Group).
3. Optimizing Operations & Efficiency
Data analytics eliminates inefficiencies, reduces costs, and improves overall business performance by streamlining operations.
Businesses that embrace big data analytics see a 10% reduction in operational costs (Forbes).
4. Fraud Detection & Risk Management
With increasing cyber threats and fraudulent activities, data analytics plays a key role in detecting anomalies and preventing financial losses.
5. Gaining Competitive Advantage
In highly competitive industries, businesses using advanced analytics can outperform rivals by making faster, smarter, and more strategic moves.
Data-driven businesses are 5 times more likely to make faster decisions than competitors (Gartner).
Final Thoughts
Understanding these four types of data analytics is essential for any business looking to gain a competitive edge. Whether you’re analyzing past trends, diagnosing issues, forecasting future outcomes, or making strategic decisions, data analytics can help you reduce risks, improve efficiency, and maximize profits.
Want to leverage data analytics for your business? Start by identifying which type fits your needs best!


Tags: