

PIM ROI for Retailers: A Practical Guide to Measuring Business Impact
How much is your team really spending on managing product data each month?
How many hours go into fixing inconsistencies before every product launch?
These are the kinds of questions every retail leader should ask before investing in a Product Information Management (PIM) solution.
The truth is, most retailers underestimate the hidden costs of scattered product data and the return a centralised PIM can deliver.
Studies show that companies implementing a modern PIM see an average 20–25% reduction in operational costs related to product data, along with faster launches and fewer returns.
That’s a measurable business impact, not just a technology upgrade.
But how do you put real numbers behind that value? How do you calculate if a PIM will truly pay off for your business?
That’s exactly what a PIM ROI calculator helps you do. By turning operational improvements into tangible metrics such as time saved, revenue gained, and costs reduced, it reveals the financial case for better product data management.
What you will learn
By the end of this article, you’ll be able to:
- Understand what “PIM ROI” means for a retail business and why it matters in today’s omnichannel world
- Identify all the key business inputs you’ll need to feed into a PIM ROI calculator
- Follow a clear, three-step walkthrough of the calculator
- See how the ROI formula works in a practical way, including how to translate time-savings, error-reductions, and faster launches into financial benefit
- Recognise the factors and pitfalls that may affect your ROI calculation (both visible and hidden), so your model is realistic
What You’ll Need to Gather
Before you start calculating your PIM ROI, you’ll need to gather a few key pieces of information about your business. Don’t worry if you don’t have precise numbers; even realistic estimates will help you understand the potential return. Consider this step as laying the foundation for your calculation.
1. Product and Sales Information
Start with your product catalog and sales footprint.
- Number of SKUs: How many products do you currently manage, and how many new ones do you plan to launch in the next year?
- Attributes per product: On average, how many details are tracked for each product size, color, material, weight, dimensions, compliance tags, and so on?
- Sales channels: Where do you sell your products, your own website, retail stores, marketplaces, distributors, or all of them?
- Languages or regions: How many languages or regional versions of product data do you maintain?
The size and complexity of your catalog directly affect the effort required to manage it. If you’re handling product data across multiple channels and languages, the time and risk multiply quickly. A PIM solution reduces that overhead by centralizing and standardizing everything in one place.
Use our PIM Cost Calculator to estimate the total cost of implementing a Product Information Management solution for your business
2. Team and Content Efficiency
Now, consider the people behind the product information.
- Time spent managing product data: Estimate how many hours your team spends each week or month updating product details, fixing errors, and uploading changes to different systems.
- Average hourly rate: What does that time cost your business? Include not just salaries, but also agency or freelancer costs if you outsource content or translations.
- Copywriting and translation costs: How much are you currently paying for product descriptions, translations, or localized content?
Manual product management is time-consuming. Every spreadsheet, email, and revision adds up to lost hours that could be spent on higher-value work. PIM automation and workflow management significantly reduce these manual processes, enabling teams to work faster and with fewer errors.
3. Revenue and Performance Metrics
Finally, focus on your sales and performance data.
- Average revenue per product: What does one product generate on average in a month or quarter?
- Average daily sales: How many units do you sell daily, and what’s your average order value?
- Time-to-market: How long does it take to launch a new product across all your channels today?
- Return rate: What percentage of sales end up being returned due to incorrect or missing product information?
The faster you launch new products and the more accurate your product data, the more revenue potential you unlock. When your information is consistent and up to date, your listings go live faster, returns decrease, and customers gain confidence to make a purchase. Those are direct contributors to a stronger ROI.
Three Steps to Calculate Your PIM ROI
Now that you’ve gathered your key business figures, it’s time to put them to work. A PIM ROI calculator is essentially a framework for translating operational data into financial outcomes.
By following three simple steps, you can estimate how much value a Product Information Management system could deliver to your retail business in both savings and new revenue potential.
Step 1: Estimate the Time and Cost You Could Save
Start by identifying how much time your team currently spends on product data management. This includes updating descriptions, adding new attributes, reviewing translations, fixing inconsistencies, and publishing updates to each channel.
For example, if your product team spends around 100 hours each month managing data, and their average hourly cost is ₹1,500 (or $20), that’s ₹150,000 per month purely on manual work.
Now, estimate how much of that can be automated or streamlined with a PIM system. Most businesses experience a 30% to 50% reduction in time spent on repetitive tasks after implementing PIM workflows. Multiply those saved hours by the hourly rate, and you’ll have a solid estimate of your annual cost savings.
Step 2: Evaluate Your Current Product Data Process
Next, examine how your current systems manage product data and identify any inefficiencies that may be present.
Are you using multiple spreadsheets?
Does every marketplace or retailer require separate uploads for each product?
Are translation and enrichment handled manually?
List your pain points and rate their impact on time, cost, and accuracy. This gives you a baseline for comparison.
A PIM system helps by:
- Centralizing all product data in one place
- Automating updates across all channels
- Reducing errors and duplicated effort
- Managing language variations and localisations efficiently
Using your gathered data, estimate how much improvement you could expect.
Step 3: Measure the Revenue Impact of Better Product Data
Here’s where the real ROI starts to show. Improved product information doesn’t just save time; it drives top-line growth.
When customers see complete, consistent, and accurate product details, they’re more likely to make a purchase and less likely to return.
In fact, retailers with enriched product content report conversion rates up to 23% higher than those with incomplete data.
To calculate this impact, focus on three areas:
Faster time-to-market:
Estimate how many days you could save when launching new products. Multiply that by your daily sales average, and you’ll know how much extra revenue those days could bring in.Higher conversion rates:
Use your website analytics or marketplace data to project how even a small lift in conversion (say, 2% to 2.5%) could increase total sales over time.Fewer returns:
Determine the cost of handling and logistics for each return. If better data accuracy can reduce returns by even 5%, that can translate into significant yearly savings.
Add these numbers together with your time savings, cost reductions, and revenue gains, and you’ll have a strong picture of your total potential benefit.
Bringing It All Together
Once you’ve estimated your total benefits, compare them against the cost of your PIM implementation, including software, integration, and ongoing maintenance. You can then apply the basic ROI formula:
PIM ROI = ((Total Benefits – Total Costs) / Total Costs) × 100
The final number represents your percentage return on investment.
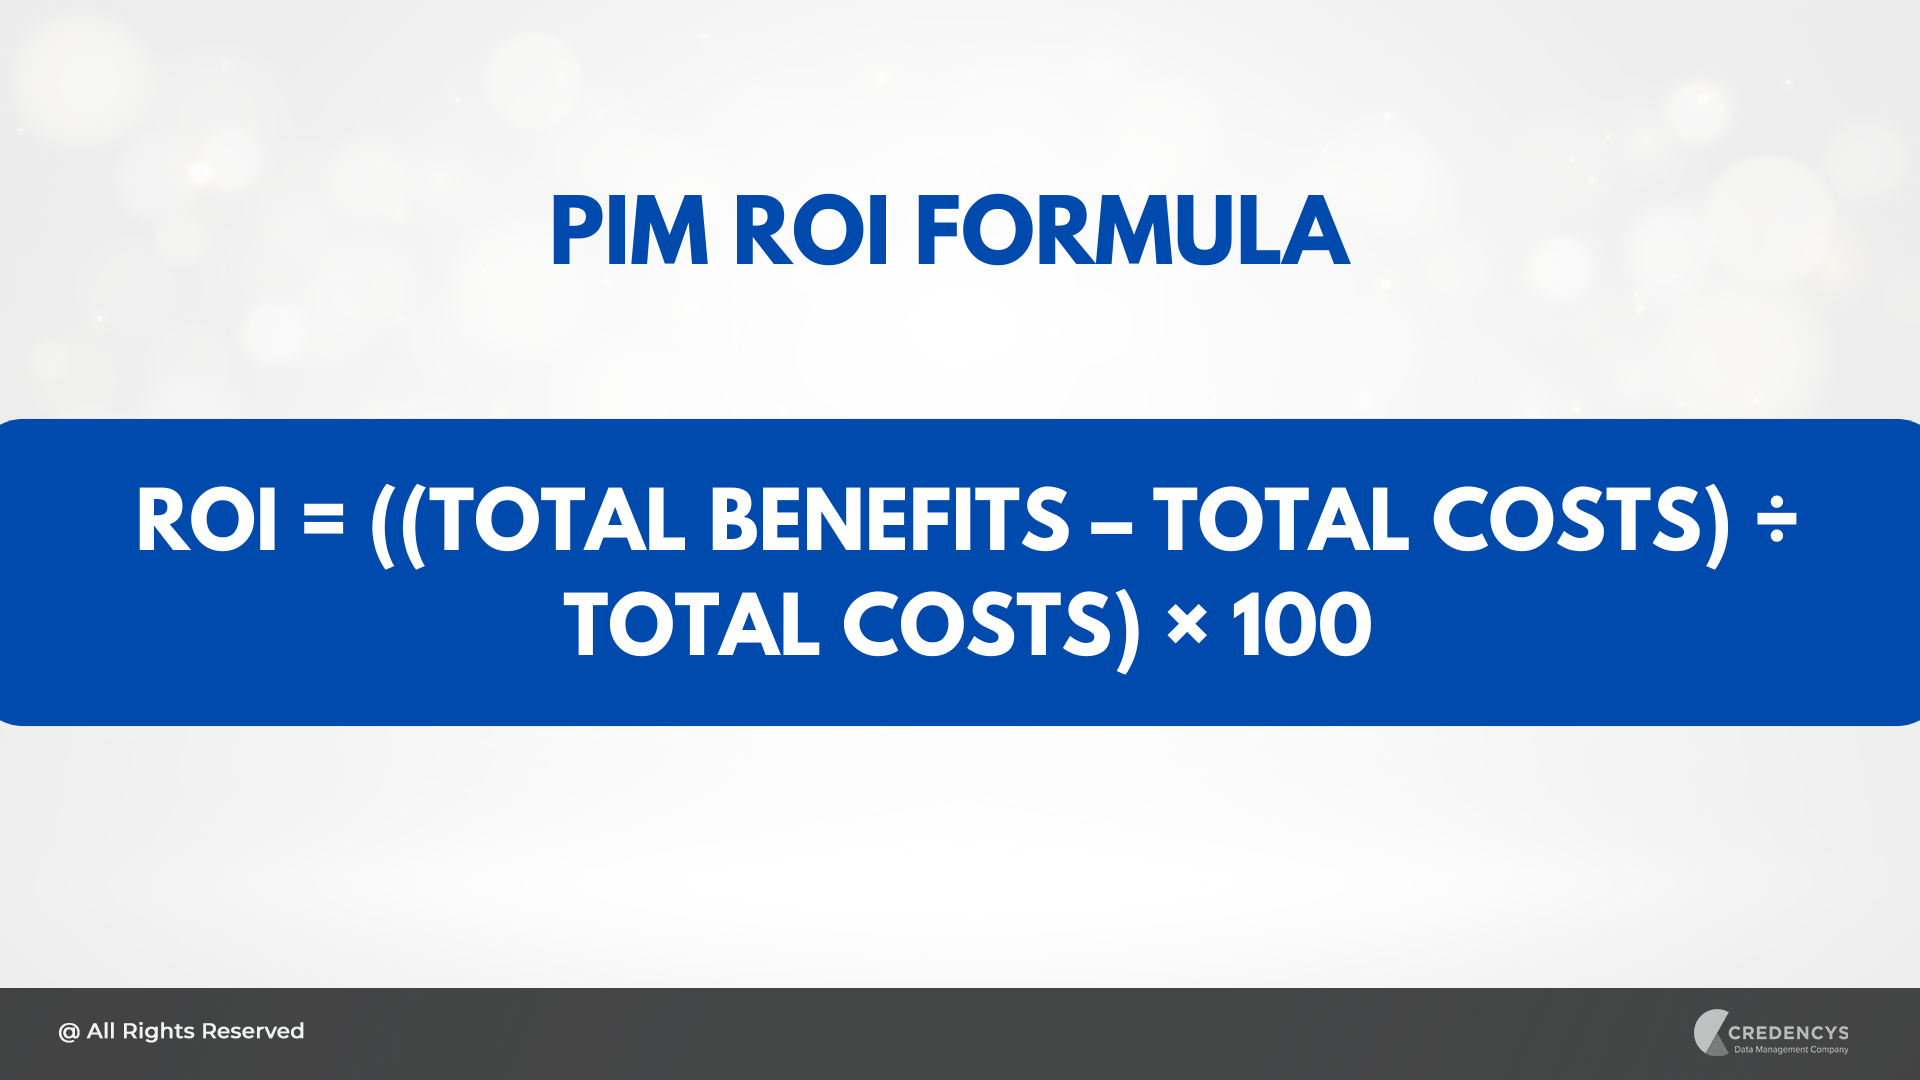
For instance, if your total benefits over a year amount to ₹1 crore, and your total cost of ownership is ₹40 lakh, your ROI is 150%. That means every ₹1 you invest in PIM returns ₹2.5 in value.
Remember, these numbers don’t have to be perfect; they just need to be realistic. The more accurate your inputs, the more reliable your ROI estimate will be.
Key Factors That Influence PIM ROI
Calculating your PIM ROI isn’t just about plugging numbers into a formula. The accuracy of your results depends on understanding what actually drives that return. Some factors will create immediate, visible savings, while others build long-term value that grows with your business.
Here are the key elements you should keep in mind as you calculate and interpret your results.
Key Factor | How It Impacts ROI |
|---|---|
| Product Catalogue Size & Complexity | The larger and more detailed your catalog, the greater the effort required to manage it manually. A PIM centralizes updates across all channels, reducing time, errors, and duplication. |
| Number of Channels & Languages | Each new channel or language adds work and risk. A PIM automates distribution and maintains data consistency across all platforms, resulting in significant time and cost savings. |
| Team Productivity & Efficiency | Manual data handling wastes time and focus. PIM automation streamlines workflows, cuts repetitive tasks, and boosts overall productivity. |
| Data Accuracy & Error Reduction | Inaccurate data leads to returns and lost trust. A single source of truth ensures consistency and reduces costly mistakes across channels. |
| Time-to-Market | PIM accelerates product launches by automating updates and approvals, enabling retailers to bring products to market faster and sell them sooner. |
| Customer Experience & Conversions | High-quality, complete data builds customer confidence. Retailers often experience a 15–25% increase in conversions and a decrease in returns after adopting PIM. |
| Scalability & Growth | A PIM supports business expansion without adding proportional costs. As you scale SKUs and channels, your operations remain lean and efficient. |
| Implementation & Change Management | ROI depends on a smooth rollout. Include costs for integration, training, and adoption. Well-managed onboarding accelerates results. |
| Data Governance | Maintaining clear data standards and ownership ensures long-term consistency, keeping your PIM delivering value over time. |
| Strategic & Intangible Benefits | PIM enhances collaboration, supplier coordination, and data-driven decision-making, intangible benefits that boost competitiveness and long-term ROI. |
How to Quantify and Interpret Your PIM ROI Results
Once you’ve entered all your data into the PIM ROI calculator, your product catalog details, team effort, and sales metrics, the next step is to make sense of the numbers. This is where the data turns into insight.
Here’s how to quantify your ROI accurately and interpret what those results really mean for your business.
1. Calculate Your Total Benefits
Your total benefits include all measurable gains from implementing PIM — both cost savings and revenue growth.
Add up:
Time savings: Hours saved × average hourly rate
Cost reductions: Fewer manual tasks, reduced translation or content creation expenses
Revenue uplift: Faster launches, higher conversions, fewer returns
2. Subtract Your Total Costs
Now, total up your PIM-related costs:
- Software licenses or subscription fees
- Implementation and integration
- Training, data migration, and ongoing maintenance
For most businesses, these costs are front-loaded, meaning you invest more in the first year, then your operational costs stabilize.
This is why the ROI tends to improve significantly after the first 12 months.
3. Apply the ROI Formula
Once you have both numbers, use the simple formula:
PIM ROI = ((Total Benefits – Total Costs) ÷ Total Costs) × 100
Let’s say your total benefits equal ₹35 lakh, and your total cost of ownership (software + implementation) is ₹14 lakh.
PIM ROI = ((35 – 14) ÷ 14) × 100 = 150%
That means for every ₹1 invested in your PIM, your business earns ₹2.50 in measurable value — either through saved time, reduced errors, or faster sales.
4. Understand What the Numbers Represent
Your ROI percentage is important, but context matters more. A 150% ROI doesn’t just mean “more profit.” It signals:
- Higher operational efficiency: Your teams can handle more SKUs or channels without needing to add staff.
- Reduced data chaos: Errors, returns, and delays are shrinking.
- Faster decision-making: Leadership can trust product data to make quicker pricing or go-to-market choices.
ROI is as much about confidence and scalability as it is about pure financial return.
5. Compare Short-Term vs Long-Term Value
Don’t stop at year one. A PIM investment compounds over time. Within the first 6–12 months, most of your ROI is derived from time and cost savings. But in later years, your biggest value comes from scale, more channels, faster launches, better conversions, and fewer operational bottlenecks.
Think of PIM ROI in three phases:
Short-term (0–6 months): Cost and time savings
Mid-term (6–18 months): Improved accuracy, reduced returns, and team productivity gains
Long-term (18+ months): Revenue growth and scalability
6. Look Beyond the Percentage
While ROI gives you a numeric snapshot, it’s not the whole story.
Some of the biggest benefits, such as improved collaboration, stronger customer trust, and faster adaptation to market changes, don’t appear in the formula.
When interpreting your PIM ROI, pair the financial outcomes with qualitative improvements.
7. Use ROI as an Ongoing Metric
ROI shouldn’t be calculated once and forgotten. Treat it as a performance metric. Revisit it quarterly or annually to assess how your PIM investment continues to yield returns. As your catalog grows or new channels open, your ROI will evolve, often improving as efficiencies compound.
Wrapping Up
Measuring the ROI of your PIM system isn’t just a financial exercise — it’s a way to understand how efficiently your business operates. When you calculate your PIM ROI, you’re not just proving the worth of a software investment; you’re uncovering the hidden potential in your data, processes, and people.
For most retailers, the value of a PIM becomes clear within the first year. Teams spend less time fixing data issues, product launches move faster, and customers get richer, more reliable product experiences. Over time, these improvements compound, creating a foundation for scalable and profitable growth.
A well-structured PIM ROI calculator helps you see that potential in numbers: the hours saved, the costs reduced, the sales gained, and the confidence restored in your product data.
Ready to uncover your true PIM ROI? Our experts can help you analyze your current product data operations, identify efficiency gaps, and estimate the real financial impact of a PIM solution tailored to your business.
Frequently Asked Questions (FAQs)
1. What is PIM ROI, and why does it matter for retailers?
PIM ROI (Product Information Management Return on Investment) measures the financial and operational value gained from implementing a PIM system. For retailers, it demonstrates the significant time, cost, and revenue improvements a centralized product data platform delivers compared to manual or fragmented systems.
2. How can a PIM ROI calculator help my business?
A PIM ROI calculator helps you estimate the potential return from adopting a PIM solution by analyzing your current catalog size, team effort, content costs, and sales metrics. It translates time savings and process efficiencies into tangible financial value.
3. What factors influence the ROI of a PIM system?
The main factors include the number of SKUs, sales channels, languages, team efficiency, data quality, and time-to-market improvements. Businesses with larger catalogs or more complex product data usually experience higher ROI from PIM.
4. How do Credencys experts help in calculating PIM ROI?
Credencys experts conduct a detailed assessment of your current product data workflows, identify inefficiencies, and model the expected gains after PIM implementation. They provide a personalized ROI projection to help you make confident investment decisions.


Tags: